import pandas as pd
import matplotlib.pyplot as plt
import numpy as np
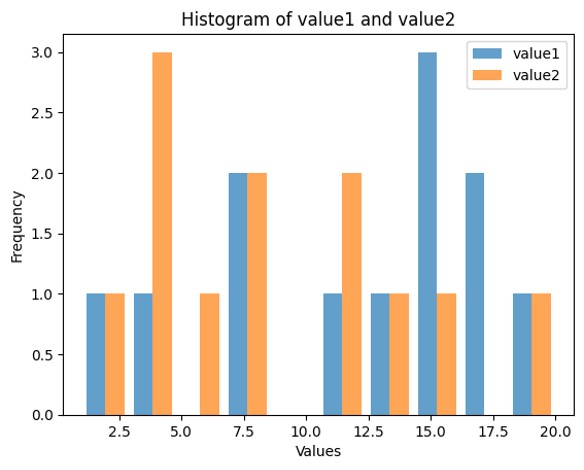
bin = np.linspace(0,20,10)
plt.hist([df['value1'], df['value2']], bins=bin, alpha=0.7, label=['value1', 'value2'])
plt.xlabel('Values')
plt.ylabel('Frequency')
plt.title('Histogram of value1 and value2')
plt.legend()
plt.show()
# サブプロットを作成
fig, ax = plt.subplots()

# ヒストグラムをプロット
ax.hist([df['value1'], df['value2']], bins=10, alpha=0.7, label=['value1', 'value2'])
ax.set_xlabel('Values')
ax.set_ylabel('Frequency')
ax.set_title('Histogram of value1 and value2')
ax.legend()

# グラフを表示
plt.show()